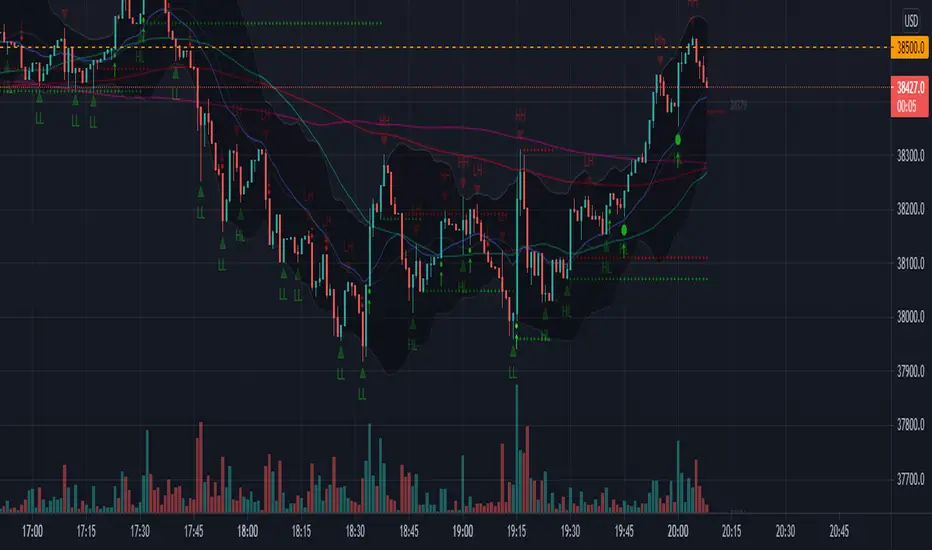
FullPac4Trader (I.Denis)The script combines the three most important indicators on the chart.
1. A set of six moving averages ( EMA and SMA ), which can be turned on and adjusted at your discretion.
2. Indication of support and resistance levels, calculated according to the Bollinger scheme.
3. Pivot Point and the nearest goals using the Floor method with the possibility of selecting a time period.
The script version is v.1 (beta)
The development of this script will continue. Feedback and suggestions are welcome.
"the script" için komut dosyalarını ara
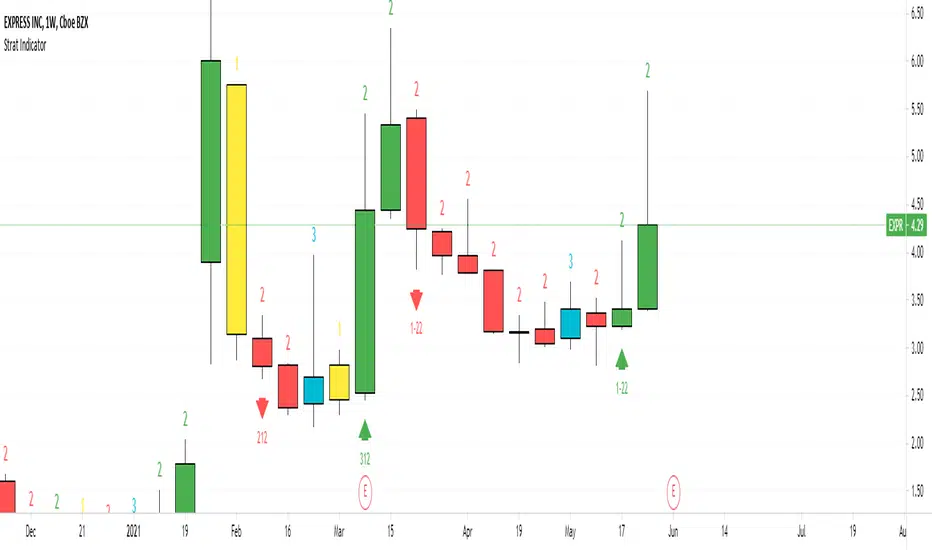
Strat IndicatorThe script implements the Strat method of trading.
Script will label the candles as 1,2,3 where 1 = inside candle. 2 = trend candle, 3 = outside candle.
The bullish , bearish and continuation patterns are labelled with the relevant strat combination
and up, down rrows.
Some setups are
2-1-2 Bearish Reversal = 2 green candle, 1 inside candle, 2 red candle
This indicator can be used in all timeframes.
It can be used on Split screen
for Intraday 1 hour & 15 min
For Swing 1 day & 1 hour
For Long term 1 week & 1 day
For 6 continuous 2 candles, the script will mark the candle as PMG "Pivot Machine Gun" this a big reversal.
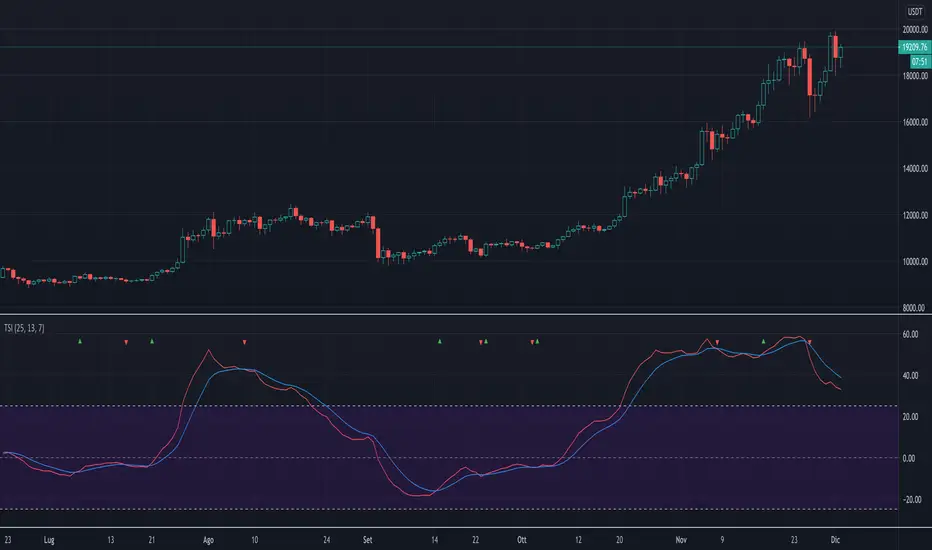
True Strength IndexThe script implements a custom version of TSI (True Strength Index). This index may be useful for determining overbought and oversold conditions, indicating potential trend direction changes via centerline or signal line crossovers, and warning of trend weakness through divergence.
The script highlights when TSI line crosses the signal line with a colored triangle, that is
when the TSI line crosses above the signal line from below, that may warrant buying, a green triangle that's pointing up is drawned;
when the TSI line crosses below the signal line from above, that may warrant selling, a red triangle that's pointing down is drawned.
Note: Signal line crossovers occur frequently, so should be utilized only in conjunction with other signals from the TSI.
The script is very easy to use and it is possible to change the following parameters:
EMA smoothing period for momentum (default value is 25)
EMA smoothing period for smoothed momentum (default value is 13)
Signal line period (default value is 7)
The type of signal line: EMA or SMA (default value is EMA)
Show or not the TSI line
Show or not the signal line
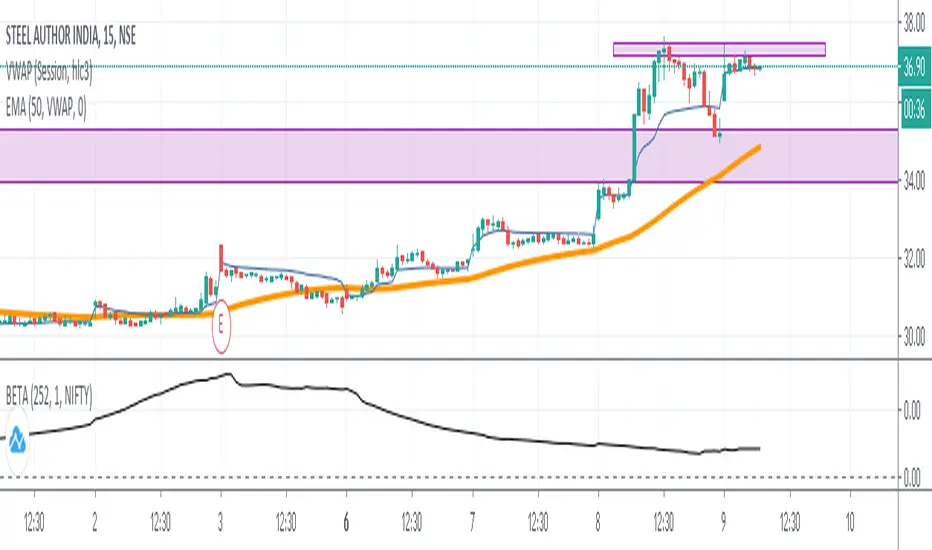
Beta 252 Days (NIFTY 50) by AkshayThe script derives the Beta Value of 252 days of a stock with Benchmark Index NIFTY 50. Note:- I have edited the script using an existing Beta script by Ricardo Santos. Thank you to him! :)
Data Structure StackThe script shows a workaround for stack in pine-script via drawings.
There are few restrictions with them:
1. The depth of the stack cannot be more that amount of allowed drawings (about 40 by now)
2. Because the stack shares the space of drawings throughout the whole script, using drawings with the stack must be careful, with handly creating and removing of each drawing, because otherwise pine's garbage collector might break the stack
3. push() and pop() must be called on every bar, because of implementation of functions in pine there are inner serieses, which must be updated on every bar. So wherever you have a setter or getter in the code - it must be called on every bar. But if it's just an update, then you should pass 'false' as a param of the funtion.
And the example of using the stack: if the stack is empty - then fill it and taking by a value per bar till the stack is emty and then fill it again.

DMI_HMA Oscillator Smoothed by HMA v2The script provided, titled "DMI_HMA Oscillator Smoothed by HMA v2," is a technical analysis tool written in Pine Script (Version 6) for the TradingView platform. It represents a hybrid approach to momentum trading, combining the directional insight of the Directional Movement Index (DMI) with the noise-reduction capabilities of the Hull Moving Average (HMA). The purpose of this indicator is to provide a cleaner, lag-reduced view of market trend strength and direction, filtering out the erratic noise often associated with raw DMI readings.
Using this indicator is highly appropriate for traders who struggle with the "noise" of standard momentum indicators but cannot afford the delay of traditional smoothing.
Noise Reduction: Standard DMI crossovers can trigger frequently in sideways markets. The HMA smoothing suppresses these minor fluctuations, helping traders stay in a trade longer without being shaken out by temporary volatility.
Lag Management: Most smoothing techniques (like SMA or EMA) introduce significant lag, making signals arrive too late. The HMA is specifically designed to minimize this, making it an excellent choice for a leading indicator like DMI.
Clarity: By converting the two-line DMI system into a single oscillator relative to a zero line, the visual complexity is reduced. A trader simply needs to observe if the teal line is above or below the gray dashed zero line.
Conclusion: The DMI_HMA Oscillator is a sophisticated yet elegant tool. It effectively addresses the primary weakness of the standard DMI (noise) without sacrificing its primary strength (responsiveness). It is best used as a trend-confirmation tool in conjunction with price action analysis, serving as a reliable filter for determining the prevailing market bias.

BTC CB Discount / PremiumThe scripts shows the difference between BTCUSD on Coinbase and BTCUSDT on Binance - also known as CB Premium & Discount.

Coefficient of Variance BarsThe script calculates the Coefficient of Variance (CV), which is the standard deviation (a measure of volatility) divided by the average price over a set period. In simple terms, it tells you how volatile the market is in relation to its current price level.
• Highlighting Volatility Increase: By default, the script colors the bars when this relative volatility makes a new high. This suggests that the market is "waking up" and that a significant price move could be starting.
• Highlighting Low Volatility (Inverse Mode): When you uncheck the box in the settings, it highlights periods where volatility is not making a new high. This is useful for spotting quiet, consolidating markets.
________________________________________
How to Use It in Trading
This indicator is a complementary tool and should be used with other forms of analysis, like price action or trend indicators.
1. Spotting Potential Breakouts
The most common use is to anticipate breakouts. When the price is moving in a tight range (consolidation) and you suddenly see a highlighted bar, it signals a surge in volatility. This is often the catalyst that pushes the price out of the range.
• Strategy: Look for a period of price consolidation. When a bar is colored, indicating a volatility spike, look for a confirmation of a breakout (e.g., a candle closing above resistance or below support) and consider entering a trade in that direction.
2. Identifying Ranging Markets
By switching to the inverse mode, you can easily see when the market is quiet and range-bound.
• Strategy: When the bars are consistently highlighted in inverse mode, it confirms a ranging market. This is the ideal environment for strategies that capitalize on sideways movement, such as using oscillators (like RSI or Stochastics) to trade between support and resistance levels.
3. Gauging Trend Strength and Exhaustion
In a strong, ongoing trend, you'll likely see intermittent volatility spikes confirming the momentum. However, a sudden, massive spike in volatility after a very long trend might signal a "climax," potentially indicating the trend is exhausted and a reversal could be near.

Dynamic VWAP Levels (V1.0)The script calculates bands around the VWAP (Volume Weighted Average Price) using the Average True Range (ATR) to adjust the levels according to market reality. Buy and sell signals are generated when the price crosses these bands.
Customizable Parameters SmoothingLength (SmoothLength): The period used to smooth the levels. A higher value results in smoother bands that are less susceptible to rapid fluctuations.
Use EMA for smoothing?: Selects between using the Exponential Moving Average (EMA) or the Simple Moving Average (SMA) for smoothing.
ATR Length: The period used to calculate the ATR, which determines the frequency.
ATR Multiplier: A multiplier that adjusts the amplitude of the bands around the VWAP.
How the Script Works Calculating VWAP and Bands: The VWAP is calculated to obtain the volume weighted average price.
Bands are created around the VWAP by adding or subtracting a fraction of the ATR to account for the current market variation.
Smoothing Application: Price levels are smoothed to reduce market noise, allowing for better visualization of trends.
Signal Generation: Buy Signal: Generated when price crosses upwards the smoothed lower band (default dp7_smooth).
Sell Signal: Generated when price crosses downwards the smoothed upper band (default dp1_smooth).

Optimized WaveletsThe script, High-Resolution Volume-Price Pressure Indicator with Wavelets, utilizes wavelet transforms and high-resolution data to analyze market pressure based on volume and price dynamics. The approach combines volume data from smaller timeframes (1 second) with non-linear transformation techniques to generate a refined view of market conditions. Here’s a detailed breakdown of how it works:
Key Components:
Wavelet Transform:
A wavelet function is applied to the price and volume data to capture patterns over a set time period. This technique helps identify underlying structures in the data that might be missed with traditional moving averages.
High-Resolution Data:
The indicator fetches 1-second high-resolution data for price movements and volume. This allows the strategy to capture granular price and volume changes, crucial for short-term trading decisions.
Normalized Difference:
The script calculates the normalized difference in price and volume data. By comparing changes over the selected length, it standardizes these movements to help detect sudden shifts in market pressure.
Sigmoid Transformation:
After combining the price and volume wavelet data, a sigmoid function is applied to smooth out the resulting values. This non-linear transformation helps highlight significant moves while filtering out minor fluctuations.
Volume-Price Pressure:
The up and down volume differences, together with price movements, are combined to create a "Volume-Price Pressure Score." The final indicator reflects the pressure exerted on the market by both buyers and sellers.
Indicator Plot:
The final transformed score is plotted, showing how price and volume dynamics, combined through wavelet transformation, interact. The indicator can be used to identify potential market turning points or pressure buildups based on volume and price movement patterns.
This approach is well-suited for traders looking for advanced signal detection based on high-frequency data and can provide insight into areas where typical indicators may lag or overlook short-term volatility.

D2MAThe script is called "D2MA" (Distance to Moving Average). It calculates the distance between the closing price and a user-selected type of moving average (MA). It also plots this distance on a chart, allowing users to see how far the price is from the chosen moving average. Users can choose to display this distance as either an absolute value or as a percentage.
Input Parameters
Length (len): The number of bars (or periods) used to calculate the moving average.
Source (src): The price data used for calculations, typically the closing price.
Percentage Distance (pc): A boolean option to display the distance as a percentage instead of an absolute value.
MA Type (maType): The type of moving average to use.
Simple Moving Average (SMA)
Exponential Moving Average (EMA)
Hull Moving Average (HMA)
Arnaud Legoux Moving Average (ALMA)
Triple Exponential Moving Average (T3)
Power Weighted Moving Average (PWMA)
The script includes functions to calculate different types of moving averages:
The difference between the source price (e.g., closing price) and the calculated moving average. if Distance as Percentage , the distance expressed as a percentage of the moving average value.
Plotting the Data
Signal Line: The signal line changes colour (green or red) based on whether the distance is increasing or decreasing.
Visual Representation
How to Use
Identify Trends: By seeing how far the price is from a selected moving average, traders can gauge the strength of a trend.
Spot Reversals: Significant deviations from the moving average can signal potential reversals.

itradesize /\ IPDA Look Back - for any timeframeThe script automatically calculates the 20-40-60 look-back periods and their premium and discount ranges.
The base concept is from ICT’s IPDA which should be applied to the daily timeframe but now you can use that same concept on the lower timeframes .
The higher the timeframes you use the more reliable it will be ( when we are talking about lower timeframes than Daily ).
- With the use of the indicator you can apply it on any timeframe with ease.
- You can customize the coloring of premium & discount, frame lines, and even the look of it.
- Hide or show the EQ levels
Below the IPDA texts the indicator shows the actual percentage of the selected range based on the current price fluctuations.
The script handles the 20-40-60 days look-back as fractals so it can be applied on lower timeframes.
The basics:
- The Interbank Price Delivery Algorithm (IPDA): The algorithm creates a shift on the daily chart every 20, 40, and 60 trading days.
- These are the IPDA look-back periods. Every 20 trading days or so there is a new liquidity pool forming on both sides of the market based on ICT concepts.
- Determine the IPDA Data Range of the land 20 trading days.
- Note the highest high & lowest low in the past 20 trading days. Identify the institutional order flow and mark the relevant PD arrays in the selected IPDA look-back period we deemed useful for our trading style.
- This is your current dealing range.
- If the price consolidates for 20 days, consider switching to a 40-day look back.
Inside this dealing range, we look for the next draw on liquidity. Is it reaching for a liquidity pool or is it looking to rebalance at a particular PD Array. This is going to the Bias.
Which IPDA data range should you use?
IPDA20 can be our Short Term range - fit for intraday traders at most
IPDA40 can be our Swing Trade range - have a clear indication of the market profile
IPDA60 can be our range for position trading - have a clear indication of the market profile

Candle Pivot and Stop LossThe script plot upside and down side stop loss using pivot point and trure range.
The True Range, representing market volatility, is determined by finding the maximum value among the differences between the previous high-low, high-close, and low-close. The Downside Stop Loss is calculated by adding the True Range to the Pivot Point, while the Upside Stop Loss is calculated by subtracting the True Range from the Pivot Point.
These levels are plotted on the chart in blue (Pivot Point), red (Downside Stop Loss), and green (Upside Stop Loss), providing traders with essential reference points for their trading strategies.
The provided Pine Script calculates key trading levels for the current candle, including the Pivot Point, Downside Stop Loss, and Upside Stop Loss. The Pivot Point is computed as the average of the previous candle's high, low, and close prices.

Machine Learning using Neural Networks | EducationalThe script provided is a comprehensive illustration of how to implement and execute a simplistic Neural Network (NN) on TradingView using PineScript.
It encompasses the entire workflow from data input, weight initialization, implicit neuron calculation, feedforward computation, backpropagation for weight adjustments, generating predictions, to visualizing the Mean Squared Error (MSE) Loss Curve for monitoring the training phase.
In the visual example above, you can see that the prediction is not aligned with the actual value. This is intentional for demonstrative purposes, and by incrementing the Epochs or Learning Rate, you will see these two values converge as the accuracy increases.
Hyperparameters:
Learning Rate, Epochs, and the choice between Simple Backpropagation and a verbose version are declared as script inputs, allowing users to tailor the training process.
Initialization:
Random initialization of weight matrices (w1, w2) is performed to ensure asymmetry, promoting effective gradient updates. A seed is added for reproducibility.
Utility Functions:
Functions for matrix randomization, sigmoid activation, MSE loss calculation, data normalization, and standardization are defined to streamline the computation process.
Neural Network Computation:
The feedforward function computes the hidden and output layer values given the input.
Two variants of the backpropagation function are provided for weight adjustment, with one offering a more verbose step-by-step computation of gradients.
A wrapper train_nn function iterates through epochs, performing feedforward, loss computation, and backpropagation in each epoch while logging and collecting loss values.
Training Invocation:
The input data is prepared by normalizing it to a value between 0 and 1 using the maximum standardized value, and the training process is invoked only on the last confirmed bar to preserve computational resources.
Output Forecasting and Visualization:
Post training, the NN's output (predicted price) is computed, standardized and visualized alongside the actual price on the chart.
The MSE loss between the predicted and actual prices is visualized, providing insight into the prediction accuracy.
Optionally, the MSE Loss Curve is plotted on the chart, illustrating the loss trajectory through epochs, assisting in understanding the training performance.
Customizable Visualization:
Various inputs control visualization aspects like Chart Scaling, Chart Horizontal Offset, and Chart Vertical Offset, allowing users to adapt the visualization to their preference.
-------------------------------------------------------
The following is this Neural Network structure, consisting of one hidden layer, with two hidden neurons.
Through understanding the steps outlined in my code, one should be able to scale the NN in any way they like, such as changing the input / output data and layers to fit their strategy ideas.
Additionally, one could forgo the backpropagation function, and load their own trained weights into the w1 and w2 matrices, to have this code run purely for inference.
-------------------------------------------------------
While this demonstration does create a “prediction”, it is on historical data. The purpose here is educational, rather than providing a ready tool for non-programmer consumers.
Normally in Machine Learning projects, the training process would be split into two segments, the Training and the Validation parts. For the purpose of conveying the core concept in a concise and non-repetitive way, I have foregone the Validation part. However, it is merely the application of your trained network on new data (feedforward), and monitoring the loss curve.
Essentially, checking the accuracy on “unseen” data, while training it on “seen” data.
-------------------------------------------------------
I hope that this code will help developers create interesting machine learning applications within the Tradingview ecosystem.

BANKNIFTY position screenerThe script takes present day's price range of the stocks (stocks of the Index being tracked included in this screener) into account, to hint strength or weakness in the underlying Index (for example: BANKNIFTY here). The day's price range of a stock is gauged on a scale of 0-100, where 0 is Day's price low and 100 is day's price high.
If a stock is in 90-100 price range section the cell with title "90" illuminates hinting the stock is trading near day's high.
Likewise, if a stock is in 0-10 price range section the cell with title "10" illuminates hinting that the stock is trading near day's low.
The price range of 10-25 is represented in the cell titled "25"
The price range of 75-90 is represented in the cell titled "75"
Only one cell from the day's range illuminates at a time for a stock, signaling the present position of that stock in the Day's range at that instant.
The script works best above 10 second time frame.
Idea: If majority of the heavy weight stocks of the Index being tracked are trading near Day's high the underlying Index must be going strong at that very instant and Vice versa.
Disclaimer: Only for studying Index movement ideas intraday, trading is not advised.

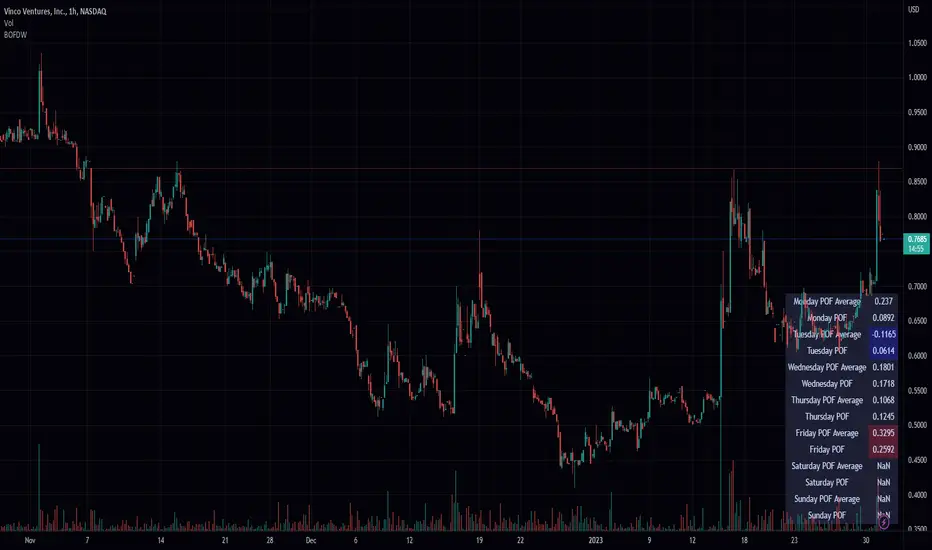
Balance of Force Day of the Week (BOFDW)The script is a custom technical indicator for TradingView that is based on an analysis of the price movements of a financial instrument over the course of a week. The indicator uses a variety of inputs, including the open and close prices for each day of the week, to determine the "BOF" (BOF) for each day.
The BOF is calculated based on the relative magnitude of bullish and bearish price movements and is then used to determine the average BOF over a moving window of data points. This average BOF is displayed on the chart as an overlay, providing a measure of the average bullishness or bearishness of the financial instrument over the course of a week.
The indicator also allows users to specify the location of the overlay on the chart and to customize the appearance of the overlay with options for text and box colors. The script provides a number of built-in options for chart position, including the top-left, top-middle, top-right, middle-left, middle-center, middle-right, bottom-left, bottom-middle, and bottom-right corners of the chart.
Overall, this custom technical indicator is a useful tool for traders and investors who are looking to gain a deeper understanding of the price trends of a financial instrument over the course of a week. By providing a clear and concise measure of the average POF over time, the indicator can help users identify key patterns in the market and make more informed trading decisions.
Balance of Force (BOF)The script "Balance of Force" is an indicator that aims to provide insight into the bullish and bearish forces present in the market by analyzing the relationship between bullish and bearish true ranges. The indicator first calculates the bearish and bullish true ranges by taking the absolute difference between the open and close prices for each period and summing these values over a user-specified length. It then calculates the ratio of the bullish true range to the bearish true range and takes the natural logarithm of this value, resulting in the "bullish-bearish ratio".
The script then calculates the standard deviation of this ratio over a user-specified length to create a measure of volatility. Using this deviation and the dominant cycle, it then applies an exponential moving average to smooth the ratio. The indicator plots the smoothed ratio, the raw ratio, and the deviation of the ratio multiplied by 1, 2 and 3 in addition to filling the area between the deviation multiplied by 3 and the log(1) with red and green. The user can use the indicator to identify potential bullish or bearish market conditions by analyzing the relationship between the smoothed ratio and the log(1) and the deviation of the ratio.

Pivot Point Moving Average (PPMA)The script is an implementation of an indicator called "PPMA", which stands for "Pivot Point Moving Average." This indicator is designed to be used as a overlay, meaning that it will be plotted on top of the underlying asset's price chart.
The main function of the PPMA indicator is to calculate a moving average based on pivot points of the underlying asset. Pivot points are commonly used in technical analysis to identify key levels of support and resistance, and this indicator uses the pivot points in a unique way to calculate the moving average.
The indicator's main function, "ppma()," is defined as taking two input parameters, "left" and "right." These parameters determine the number of bars to the left and right of a pivot point that will be used to calculate the moving average. The function uses the "ta.pivothigh()" and "ta.pivotlow()" functions to identify pivot points for the high and low prices, respectively. Then the function uses the "ta.change()" function to identify if there is a change in pivot point.
The function keeps track of the number of bars and their sum from the last pivot point until the next pivot point is reached. If there is a change in pivot point, it will reset the count and sum. It will return the sum divided by the count, which is the moving average of the prices between the two pivot points.
The script then uses the PPMA function to plot the moving average on the chart using the "plot()" function. The user is able to adjust the number of bars to the left and right of the pivot point using the "left" and "right" input parameters.
In summary, the PPMA indicator is a unique moving average that uses pivot points to calculate the average. It is designed to be used as an overlay on top of an underlying asset's price chart and can be adjusted by the user to suit their needs. It can help traders identify key levels of support and resistance in the underlying asset.

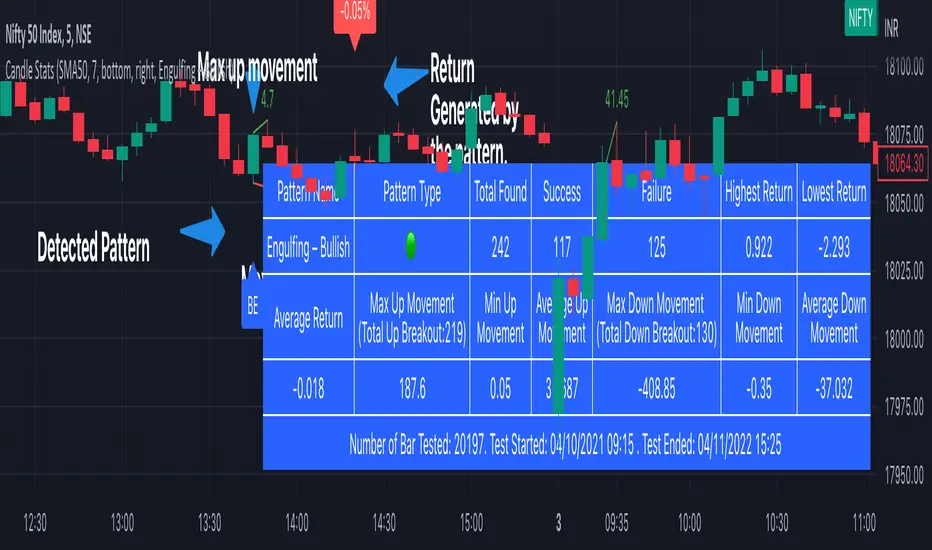
Candlestick Stats [tanayroy]The script detects candlestick patterns and stats related to the pattern. We have included 44 candle patterns to select. You can get stats for any timeframe and holding period. If a particular pattern is not available, the script will give an error.
What is available.
You can view the composite stat in the table panel.
Pattern Name: The pattern name
Pattern Type: Bullish(🟢)/ Bearish(🔴)/ Neutral(⚫)
Total Found: Number of time pattern appeared in the chart
Success: Number of time the pattern generated a positive return
Failure: Number of time the pattern generated a negative return
Highest Return: Highest return generated by the pattern (assuming trade taken at the open of the next candle and closed at the close price of the last candle of the holding period).
Lowest Return: Lowest return generated by the pattern
Average return: Average return generated by the pattern
Total Up Breakout: Number of time patterns take an up breakout(break above high).
Max Up Movement: Maximum up movement recorded by the pattern(distance between pattern high and highest high candle in given holding period).
Min up movement: Minimum up movement recorded by the pattern.
Average Up Movement: Average up movement recorded
Total Down Breakout: Number of time patterns take a down breakout(break below low).
Max Down Movement: Maximum down movement recorded by the pattern.
Min Down Movement: Minimum down movement recorded by the pattern.
Average Down Movement: Average down movement recorded
You can find the number of bars tested, start date and end date in the panel.
You can visually inspect the candle pattern performance in the chart.
Available options:
Detect Trend: You can detect trends based on SMA 50, SMA 50/200 or No detection.
Stat bars: Holding period after detecting the pattern.
Panel position: Position the stat table as per your choice.
Select pattern: Select available predefined pattern.
Label color: choose color according to your choice.
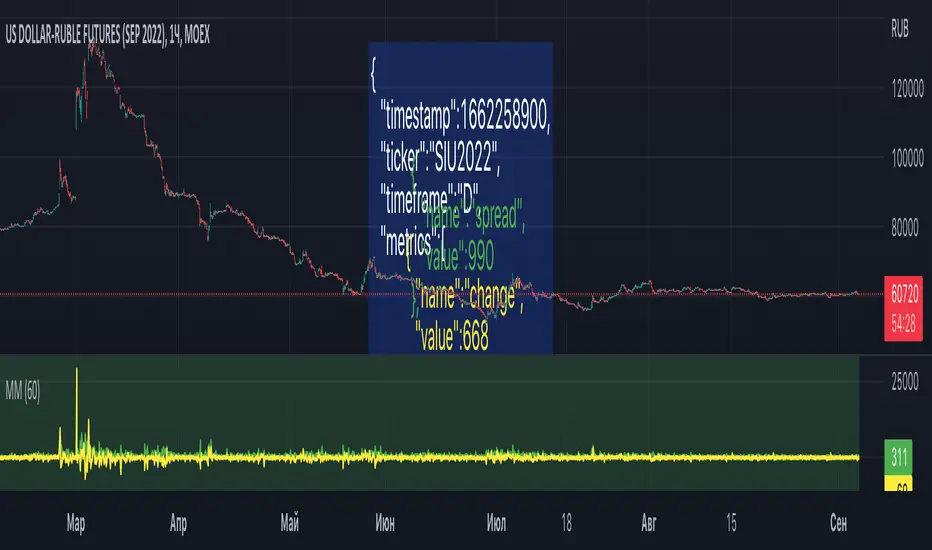
Market MonitorThe script can be used to send a JSON message to the webhook once per time. For example, to store market conditions in an external database. The latter is make sense for smaller timeframes due to TradingView limitations on the number of available bars. The interval between messages can be set in the settings. To set up transmitted market metrics, you will probably need to modify the script code to add metrics that are important to you.
tops/bottomsThe script gives market tops and bottoms.
How to use:
-In an uptrend market condition - the bottoms signifies the extent of price pullback and can be used for going long after bottoms
-In an downtrend market condition - the tops signifies the extent of price pullback and can be used for going short after tops
-In a range bound market condition - both tops and bottoms signifies the extent of price extremes in the range channel and can be used for going long after bottoms and going short after tops.
This script is designed after a heavy research done on fibonacci numbers and moving averages where 13 acts as the best reversal point of tops and bottoms, if the market goes beyond it we can adjust period with the next fibonacci numbers ie 21,34,55 etc. to know about the next turning point and trade accordingly.

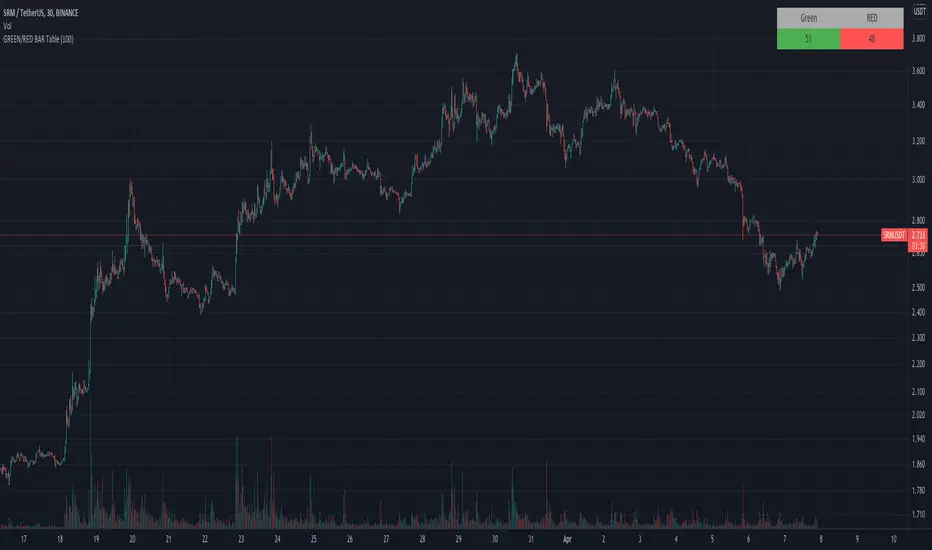
GREEN/RED BAR TableThe scripts analyzed past 100 candles stick to show the amounts of green and red bar.
INVEST BTC (from @tradinglord)The script highlight point of interest for investors using EMA, RSI and a bit of criticism.
The script is built to be used on a weekly timeframe
When RSI is bellow 35 it can be interesting to invest in BTC, on the opposite when it is above 80 can be where to take a bit of profits.
Also using EMA to flow with the power of the trend or change your bias depending on conditions.
Feel free to use the included alerts to be informed when RSI is telling you something.
The idea is quite simple, and you will not gain x100 your investment, but with these kind of investments and some patience you could make your way out.
Obviously not financial advice, understand what you are doing.
"Sometimes it's better to be rational monkey than a greedy baboon" - Tradinglord 2022
